


At Anddes Argentina, within the Project Planning and Control (PyCP) area, we are committed to maintaining high standards of accuracy and monitoring in the management of resources for both ongoing projects and those planned for the future. Under my leadership, and with the valuable contribution of professionals such as Diego Pinasco (Project Control Analyst), we have developed the Project Monitoring Statistical System (SEMP), together with other complementary tools and functions described below.
The main objective of this initiative was to provide the different management teams with clear, reliable, and real-time information to support commercial, administrative, and operational decision-making. In doing so, we aim to ensure optimal performance and results aligned with the organization’s strategic objectives.
The area is responsible for a set of key functions related to supporting the company’s various projects, structured around the following strategic pillars:
- Economic growth
Contributes to the monitoring of financial performance through the preparation of a Monthly Economic Results Report (Gross Margin) and the monthly reporting of revenue trends using progress curves. - Client Retention
In order to strengthen relationships with our clients and ensure proper project execution, the area holds a weekly meeting with the different involved departments, focused on monitoring compliance with the Work Breakdown Structure (WBS), the Deliverables List (DL), and the Schedule (SCH). In addition, committed timelines are updated on a weekly basis, ensuring traceability and compliance with agreed milestones. - Improvement of internal processes
As part of the continuous improvement process, quarterly revenue forecasts are prepared (for the next quarter, semester, and full year), together with a monthly report on company-wide timesheet workload (SCP), overseeing its correct implementation. The area also develops internal work formats and procedures aligned with the guidelines of the Integrated Management System (IMS). - Innovation and operational efficiency
To promote innovation and resource optimization, a monthly follow-up of key project control indicators (revenue, budget, and costs) is carried out using Power BI dashboards. In addition, a weekly review of project status is conducted using tools such as Excel and Project, along with the definition of installed capacity margins to support better planning and utilization of available resources. - People development
Finally, team development is a key priority. This includes the design of a career and training plan for the Project Control Analyst, with specific training in Power BI and Advanced Excel; the organization of a monthly expense review meeting between Project Managers (PMs) and area managers to assess efficient resource usage; the definition of a clear and objective job description for the analyst role to enable performance evaluation based on concrete criteria; and the organization of internal training sessions for different departments to communicate progress in project planning practices.
The SEMP system was developed as a set of multiple monitoring and control dashboards:
- Project and Revenue Status
- Comparison of Active vs. Executed Contracts
- Annual Objectives Analysis
- Pareto Analysis of Revenue by Client and by Project
- Project Balances and Locations
- Man-Hours Control (HH Control)
- Administrative Status
- Margin KPIs
- Project Expense Distribution
- Indirect Cost Index
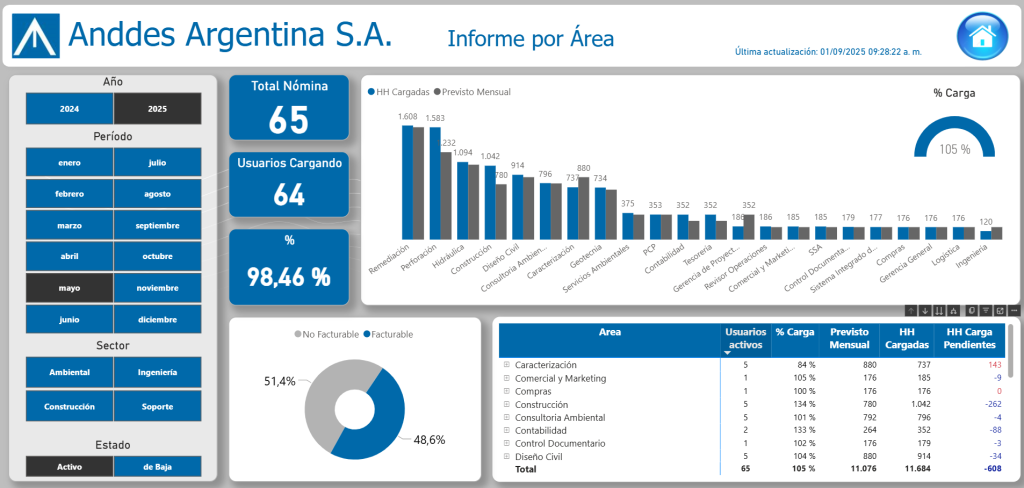
- Project Control System (SCP) Report by Area
- Users, Activities, and Billable Items
- Installed Capacity
- Availability of Man-Hours / USD (HH / USD)
This was achieved within the established timeline and scope through the design and development of dashboards that now serve as a key tool for KPI measurement, real-time data organization and management, project planning and control, as well as the collection of information related to certification processes. In addition, these dashboards make it possible to clearly and accessibly visualize the results obtained from the analysis of all the information collected.
Based on the above, the PyCP area highlights the scope, relevance, and pride in having achieved objectives that make it possible to accurately visualize the company’s overall operational health. This enables the establishment of sound recommendations and criteria for the proper execution of projects, helping to avoid deviations in schedule, costs, and revenues, and minimizing margins of error. The use of this tool also allows the different management teams to anticipate issues and make preventive decisions, fostering a work culture based on statistical analysis aligned with the initial requirements of each project.
One of the most significant achievements associated with its implementation is the commitment assumed by Senior Management to the development and active use of project monitoring and control dashboards, which supports sound and effective decision-making, benefiting both Anddes Argentina and, indirectly, its clients.